


Originally published in Japanese on Jun. 8, 2022
122-year low
There were 811,604 live births in Japan in 2021, according to data from the Ministry of Health, Labour and Welfare (MHLW) released on June 3, down 29,231 from the previous year. This marks the sixth straight year of decline and is the lowest figure since records began in 1899.
Live births are down to about 30% of their 1949 peak of 2.7 million, Japan’s first baby boom. The 2021 total fertility rate, which represents the number of births per woman over her lifetime, was 1.3, down 0.03 from 2020. This figure has also fallen for six years in a row.
The total fertility rating of 1.3 is the fourth lowest reading on record and well below the “desired birthrate of 1.8” targeted by the government.
By prefecture, the total fertility rate was highest in Okinawa at 1.80 (down from 1.83), followed by 1.65 in Kagoshima (1.61) and 1.64 in Miyazaki (1.65). The lowest reading was 1.08 in Tokyo (1.12), followed by 1.15 in Miyagi (1.20) and 1.20 in Hokkaido (1.21).
The figure is generally lower in urban areas. It also tends to be higher in the western rural regions of Japan, and lower in the eastern ones.
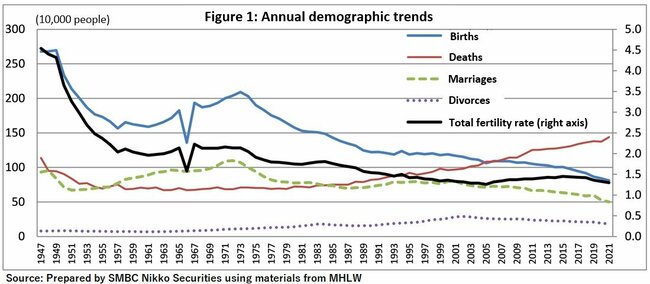
Japan’s total fertility rate surpassed 4 during the first baby boom, reaching 4.54 in 1947 and 4.4 in 1948. However, it fell into sustained decline thereafter. After hitting a record low of 1.26 in 2005, it recovered to 1.43 in 2013. It dipped to 1.42 in 2014, but the rose in 2015 to 1.45.
That year mothers aged 30 to 34, the cohort with the highest birthrate, had 5,547 more births than in 2014 thanks in part to economic recovery.
But then the recovering birthrate peaked.
In 2016 there were 9,959 fewer births than in 2015, and the drop-off accelerated, falling a further 9,577 in 2017, 10,535 in 2018, and 22,324 in 2019. The descent then slowed, falling to 9,146 in 2020 and 11,001 in 2021.
Broken down by the age of mothers, the number of births in 2021 among those aged 35 and older increased from the previous year, but it fell for those 34 and younger. The birthrate was nonetheless highest among those aged 30 to 34.
On top of the falling birthrate among mothers aged 30 to 34, the children of the baby boom are now roughly 50 years old (47 to 51). This is likely the main reason the total fertility rate began to drop again from 2016.
Although a new government agency is set to be created next year to centralize policymaking related to childbirth and childcare, the data show that thus far the government’s efforts to reverse Japan’s falling birthrate have met with little success.
Pandemic impact
At the same time, there were 1.4 million deaths in 2021, 67,054 more than in 2020, and the highest since the end of World War II. That figure decreased in 2020 for the first time in 11 years but has since begun to rise again.
Since 2020, COVID-19 has had a major impact on the trends in the number of deaths. No excess mortality associated with COVID-19 was found in 2020. In fact, the number of deaths attributed to influenza fell because of the preventative measures taken to combat the pandemic. However, there was excess mortality in 2021 in Japan, as elsewhere around the world.
Excess mortality is an index that shows the increase or decrease of all deaths during a crisis, not only those because of the disease in question, compared to a normal year. Japan had excess mortality of minus 30,139 in 2020, according to an estimate by the World Health Organization, but it had 10,668 excess deaths in 2021.
The rest of the world, in contrast, had a total COVID-19 excess mortality of 14.91 million in 2020 and 2021, roughly 2.75 times larger than the number of reported deaths of 5.42 million.
The country with the greatest excess mortality was India with about 4.74 million deaths, followed by about 1.07 million in Russia, about 1.03 million in Indonesia, 930,000 in the U.S., and about 680,000 in Brazil (all median estimate values).
In Japan, the shrinking number of births and the growing number of deaths resulted in a natural population decrease of 628,205 in 2021. This was the biggest drop on record and 96,285 greater than in the previous year, confirming that the population decrease is gaining speed.
In 2021 there were 501,116 marriages, down 24,391 from the previous year and the fewest since World War II. This figure was strongly influenced by the pandemic. At the same time, the number of divorces fell by 8,867 from the previous year to 184,386.
Looking ahead
There will be two demographic points to watch in 2022: Will the number of births stop falling and begin recovering, and will the number of marriages increase with the resumption of social and economic activity after the restrictions during the initial stages of the COVID-19 pandemic.
There were 810,000 births by Japanese nationals in Japan in the 12 months through March 2022, according to an estimate from MHLW. If 2022 proves to be a typical year, that figure will decrease from April, but the number may rebound now that the COVID-19 pandemic is under greater control. It is thus unclear if the number of births will fall below 800,000 in 2022.
On top of limiting economic growth, the falling birthrate prompts anxiety over the sustainability of Japan’s pension scheme and other elements of the social safety net.
MHLW documents released in August 2019 detailing the financial health of the public pension system show that the estimated total fertility rate in 2065 is 1.44 in the median case, 1.65 in the high case, and 1.25 in the low case. These calculations are based on the actual rate of 1.45 in 2015. However, the actual rate has not reached the median estimate since it was 1.44 in 2017.
The total fertility rate was in fact 1.3 in 2021, and it may drop below that in 2022.
Insufficient determination
The government first became concerned about the declining birthrate in 1990. That year it became clear that the birthrate had dropped to 1.57 in 1989, the lowest since World War II. The record low had previously been in 1966, which marked the Hinoe-uma year in a traditional calendar. Superstition holds that Hinoe-uma is a particularly unlucky year to have children, especially girls. Various policies have been enacted since the government noticed the problem, but none have achieved the desired result.
The government goal of a birthrate of 1.8 was laid out in a 2016 document compiled during the Abe administration that serves as a demographic roadmap through 2025. However, this target is not so much “highly difficult” to achieve, but “almost impossible.”
Reaching the population replacement level of 2.07, at which the population will keep its size over the long term, is little more than a fantasy. Few developed countries in recent times have reached a rate of 2.07, and most of those with growing populations have achieved this through immigration.
Of course, simply setting the goal of 1.8 shows that the government recognizes the importance of the issue and the need for policies to address the falling birth rate. The goal itself is laudable.
The real issue is the government’s determination to tackle the issue.
The government’s 2016 document notes that sustained investment in Japan is unlikely unless the country addresses the declining birthrate with a sense of urgency. This is exactly right. However, few Japanese believe that the goal can be met with only the existing measures.
The administration of Prime Minister Yoshihide Suga proposed the creation of a “Children’s Agency” to combat the falling birthrate, and the relevant legislation to establish the new government body was submitted to the Diet by the administration of Prime Minister Fumio Kishida. The new agency is set to come online from April 1, 2023.
The new agency will need to work as a “control tower,” the government’s favored phrase for describing its function, to have an actual impact on the birthrate.
If one were to compare it to running a business, raising a child is a major endeavor that requires at least 20 years before one collects the return on investment. In other words, policies on childcare should transcend any one administration or another. Longer-term measures, such as new cross-partisan legislation or amending the constitution to stipulate measures to combat a declining birthrate, need to be considered. That will make it easier to find long-term funding and it may draw in more public discussion.
The reversed J-shaped curve
Advancing women’s position in society is also thought to be key in reversing the falling birthrate.
Women’s empowerment is often emphasized in the context of securing labor or maintaining industrial competitiveness when the population is decreasing, but women’s social advancement (political standing) is also thought to impact the total fertility rate.
Plotting the total fertility on an x-axis and the degree of women’s social advancement on the y-axis results in a reversed J-shaped curve.
Developing countries fall to the left side of the chart, Japan and South Korea in the center, and France and northern European countries on the right.
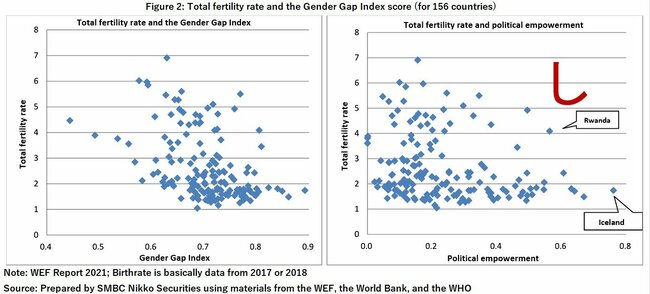
The Gender Gap Index shows the quantified gender gap in four areas: the economy, education, health and politics. The index is calculated by combining the scores in these four areas. In Japan, the index is high in health but low when it comes to economic participation and political empowerment.
The left diagram shows the relationship between the total fertility rate and the index, and the right shows the relationship between the fertility rate and the politics score. In the case of political empowerment — the degree of women’s social and political standing — the total fertility rate becomes a reversed J-shaped curve.
This curve shows that the birthrate is high in countries where women’s political empowerment is low, such as in developing countries. However, the birthrate declines with an increase in women’s political empowerment, and then increase again with a further increase in the political score.
This means that while the increased social advancement of women (such as dual-income households) initially works to suppress the birthrate, the number of births then rises as men and women both raise children together, or men do more housework, and all of society becomes supportive of childrearing.
This suggests that in countries where women participate as social leaders, holding positions like the heads of national and local governments, birthrates will likely rise with improved policies for supporting childbirth and childrearing.
The same may apply for pro-natalist policies in Japan. Moving right along the x-axis and emerging from the bottom of the reversed J-shape curve by creating an environment where women can be more active in society may be fundamental to helping the birthrate recover.
Hidenori Suezawa is Monetary and Fiscal Analyst, SMBC Nikko Securities. He graduated from the School of Law at Osaka University in 1984 and joined Mitsui Bank where he worked as a bond dealer and bond seller from 1986. After working as a senior strategist at Sakura Securities, head of financial market research at Daiwa Securities SMBC, and head of financial market research at SMBC Nikko Securities, he became a financial and fiscal analyst in 2013. The views expressed here are his own.